June 15, 2020
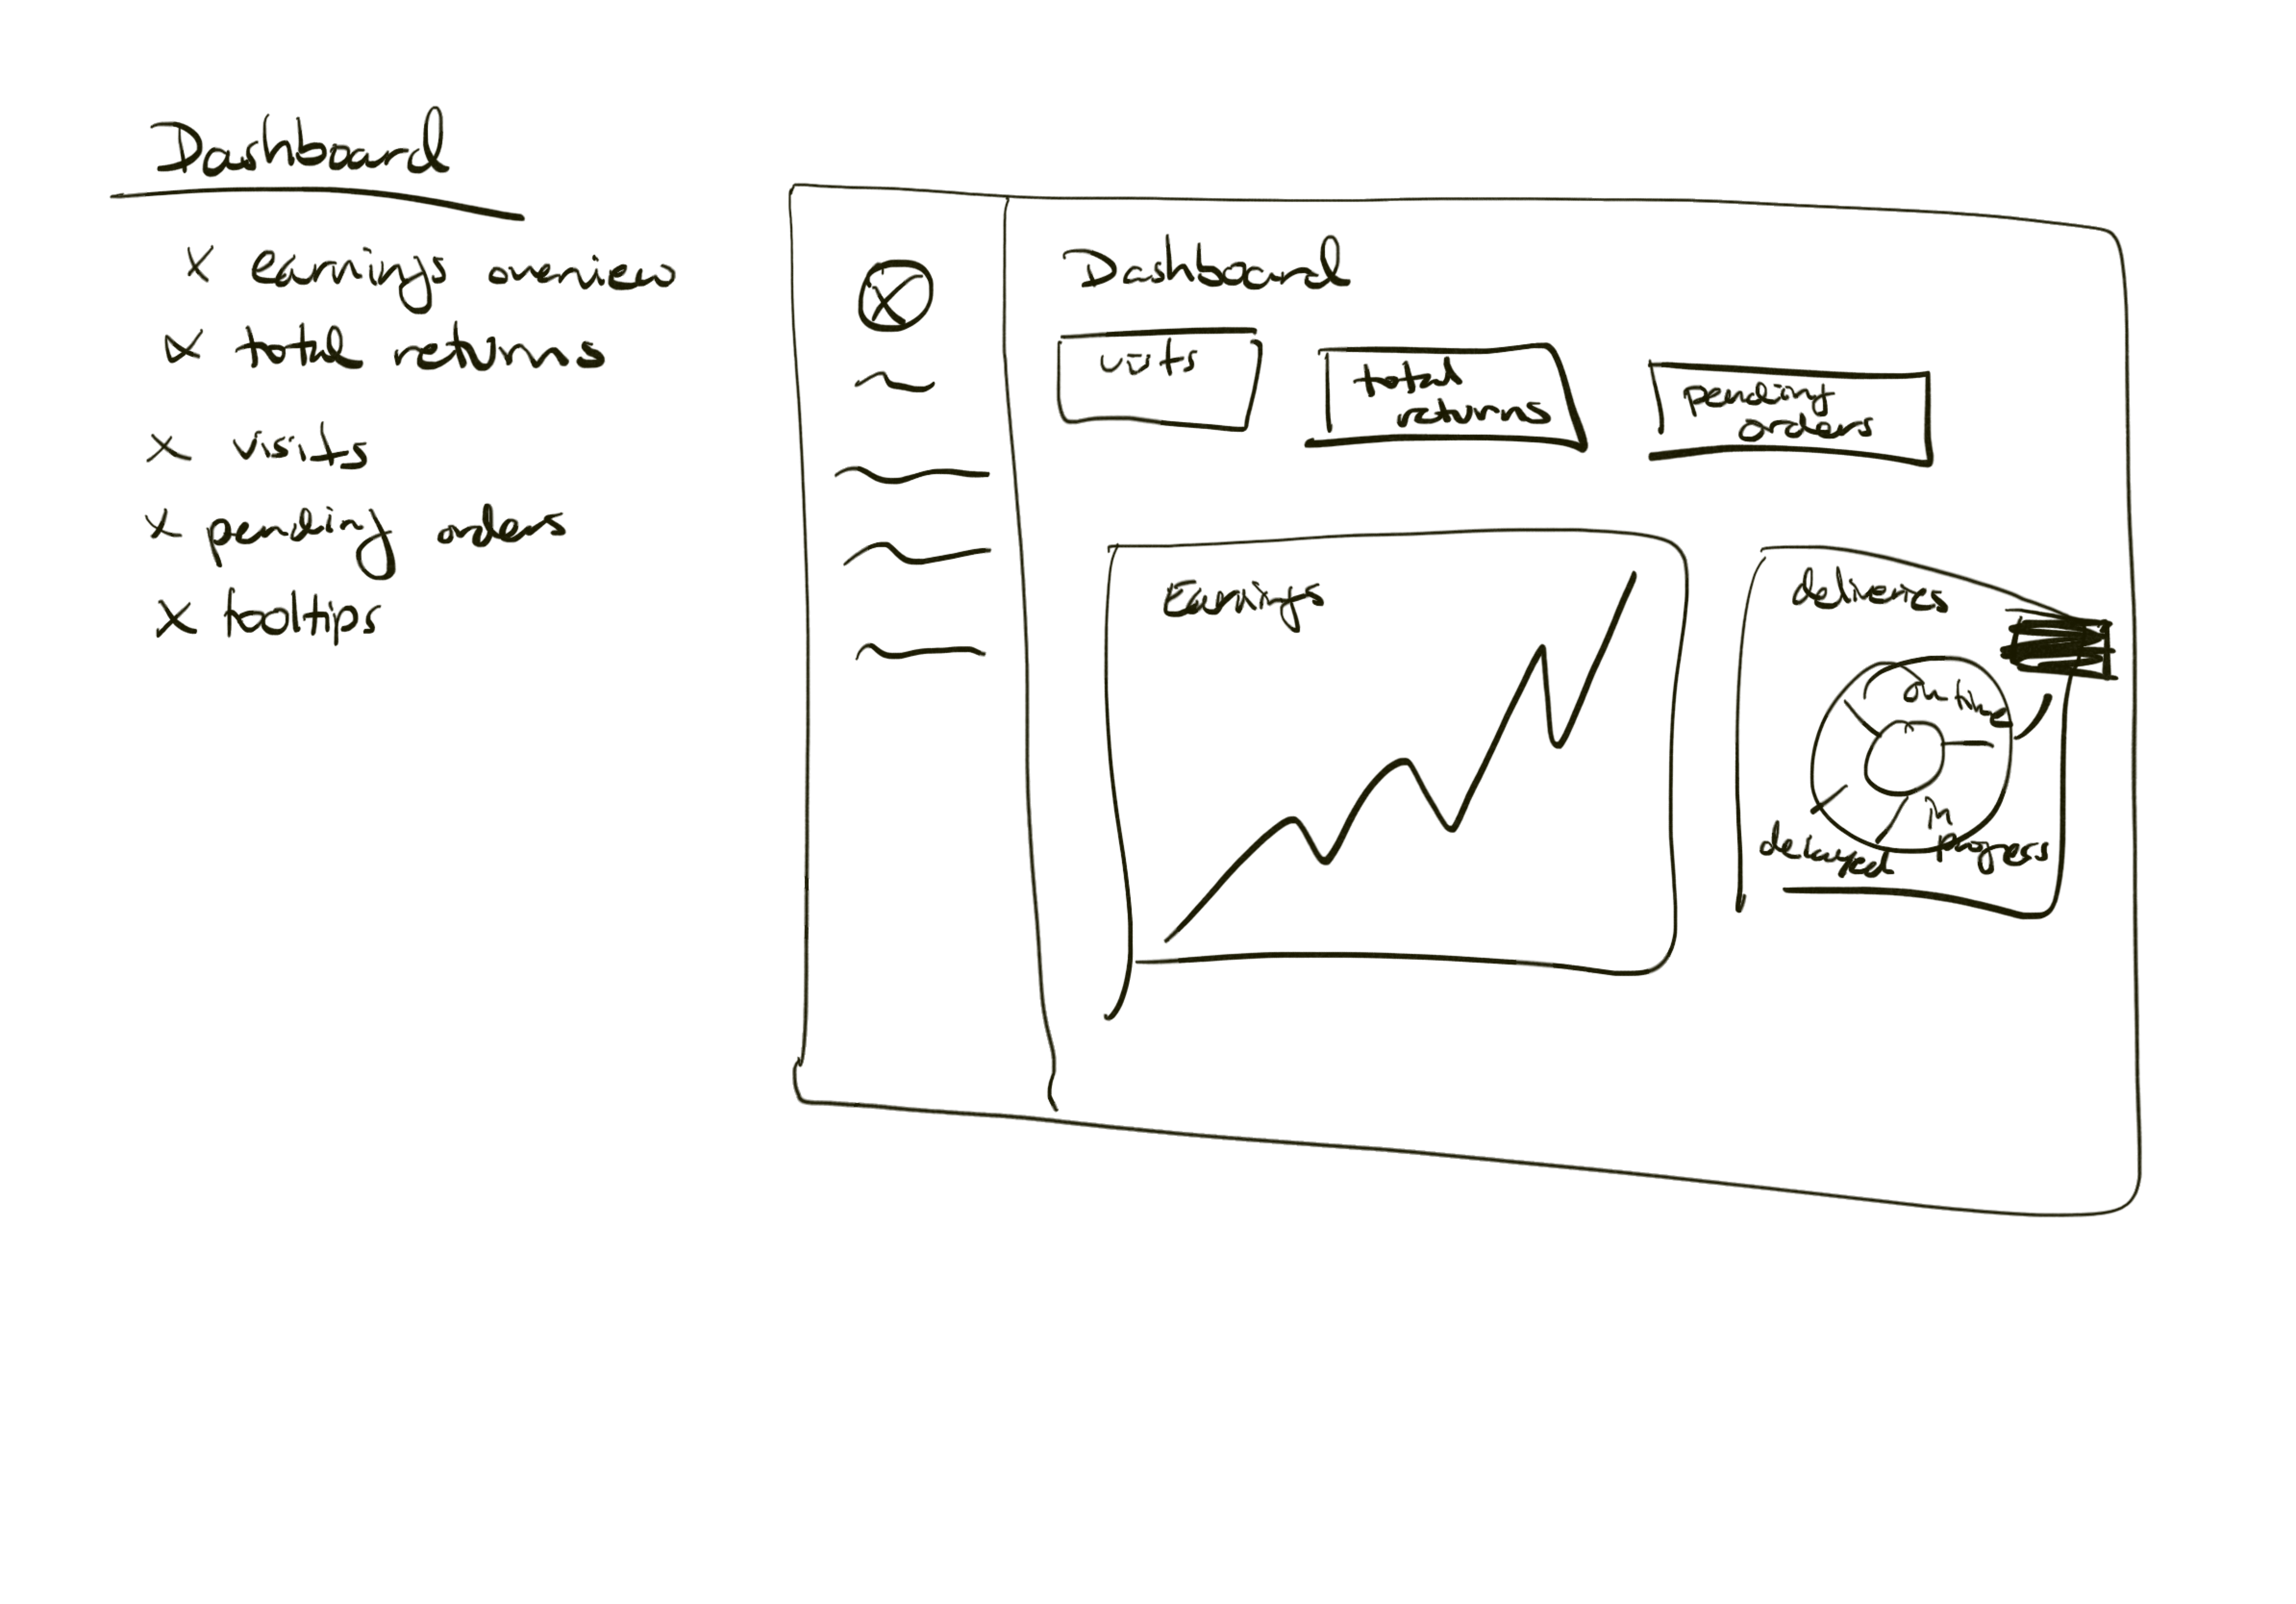
Goal: Data Pop-Up
Challenge task from Adobe XD: "Design the graph within an analytics dashboard for a website. As your users hover over the graph, display pop-ups with additional information."
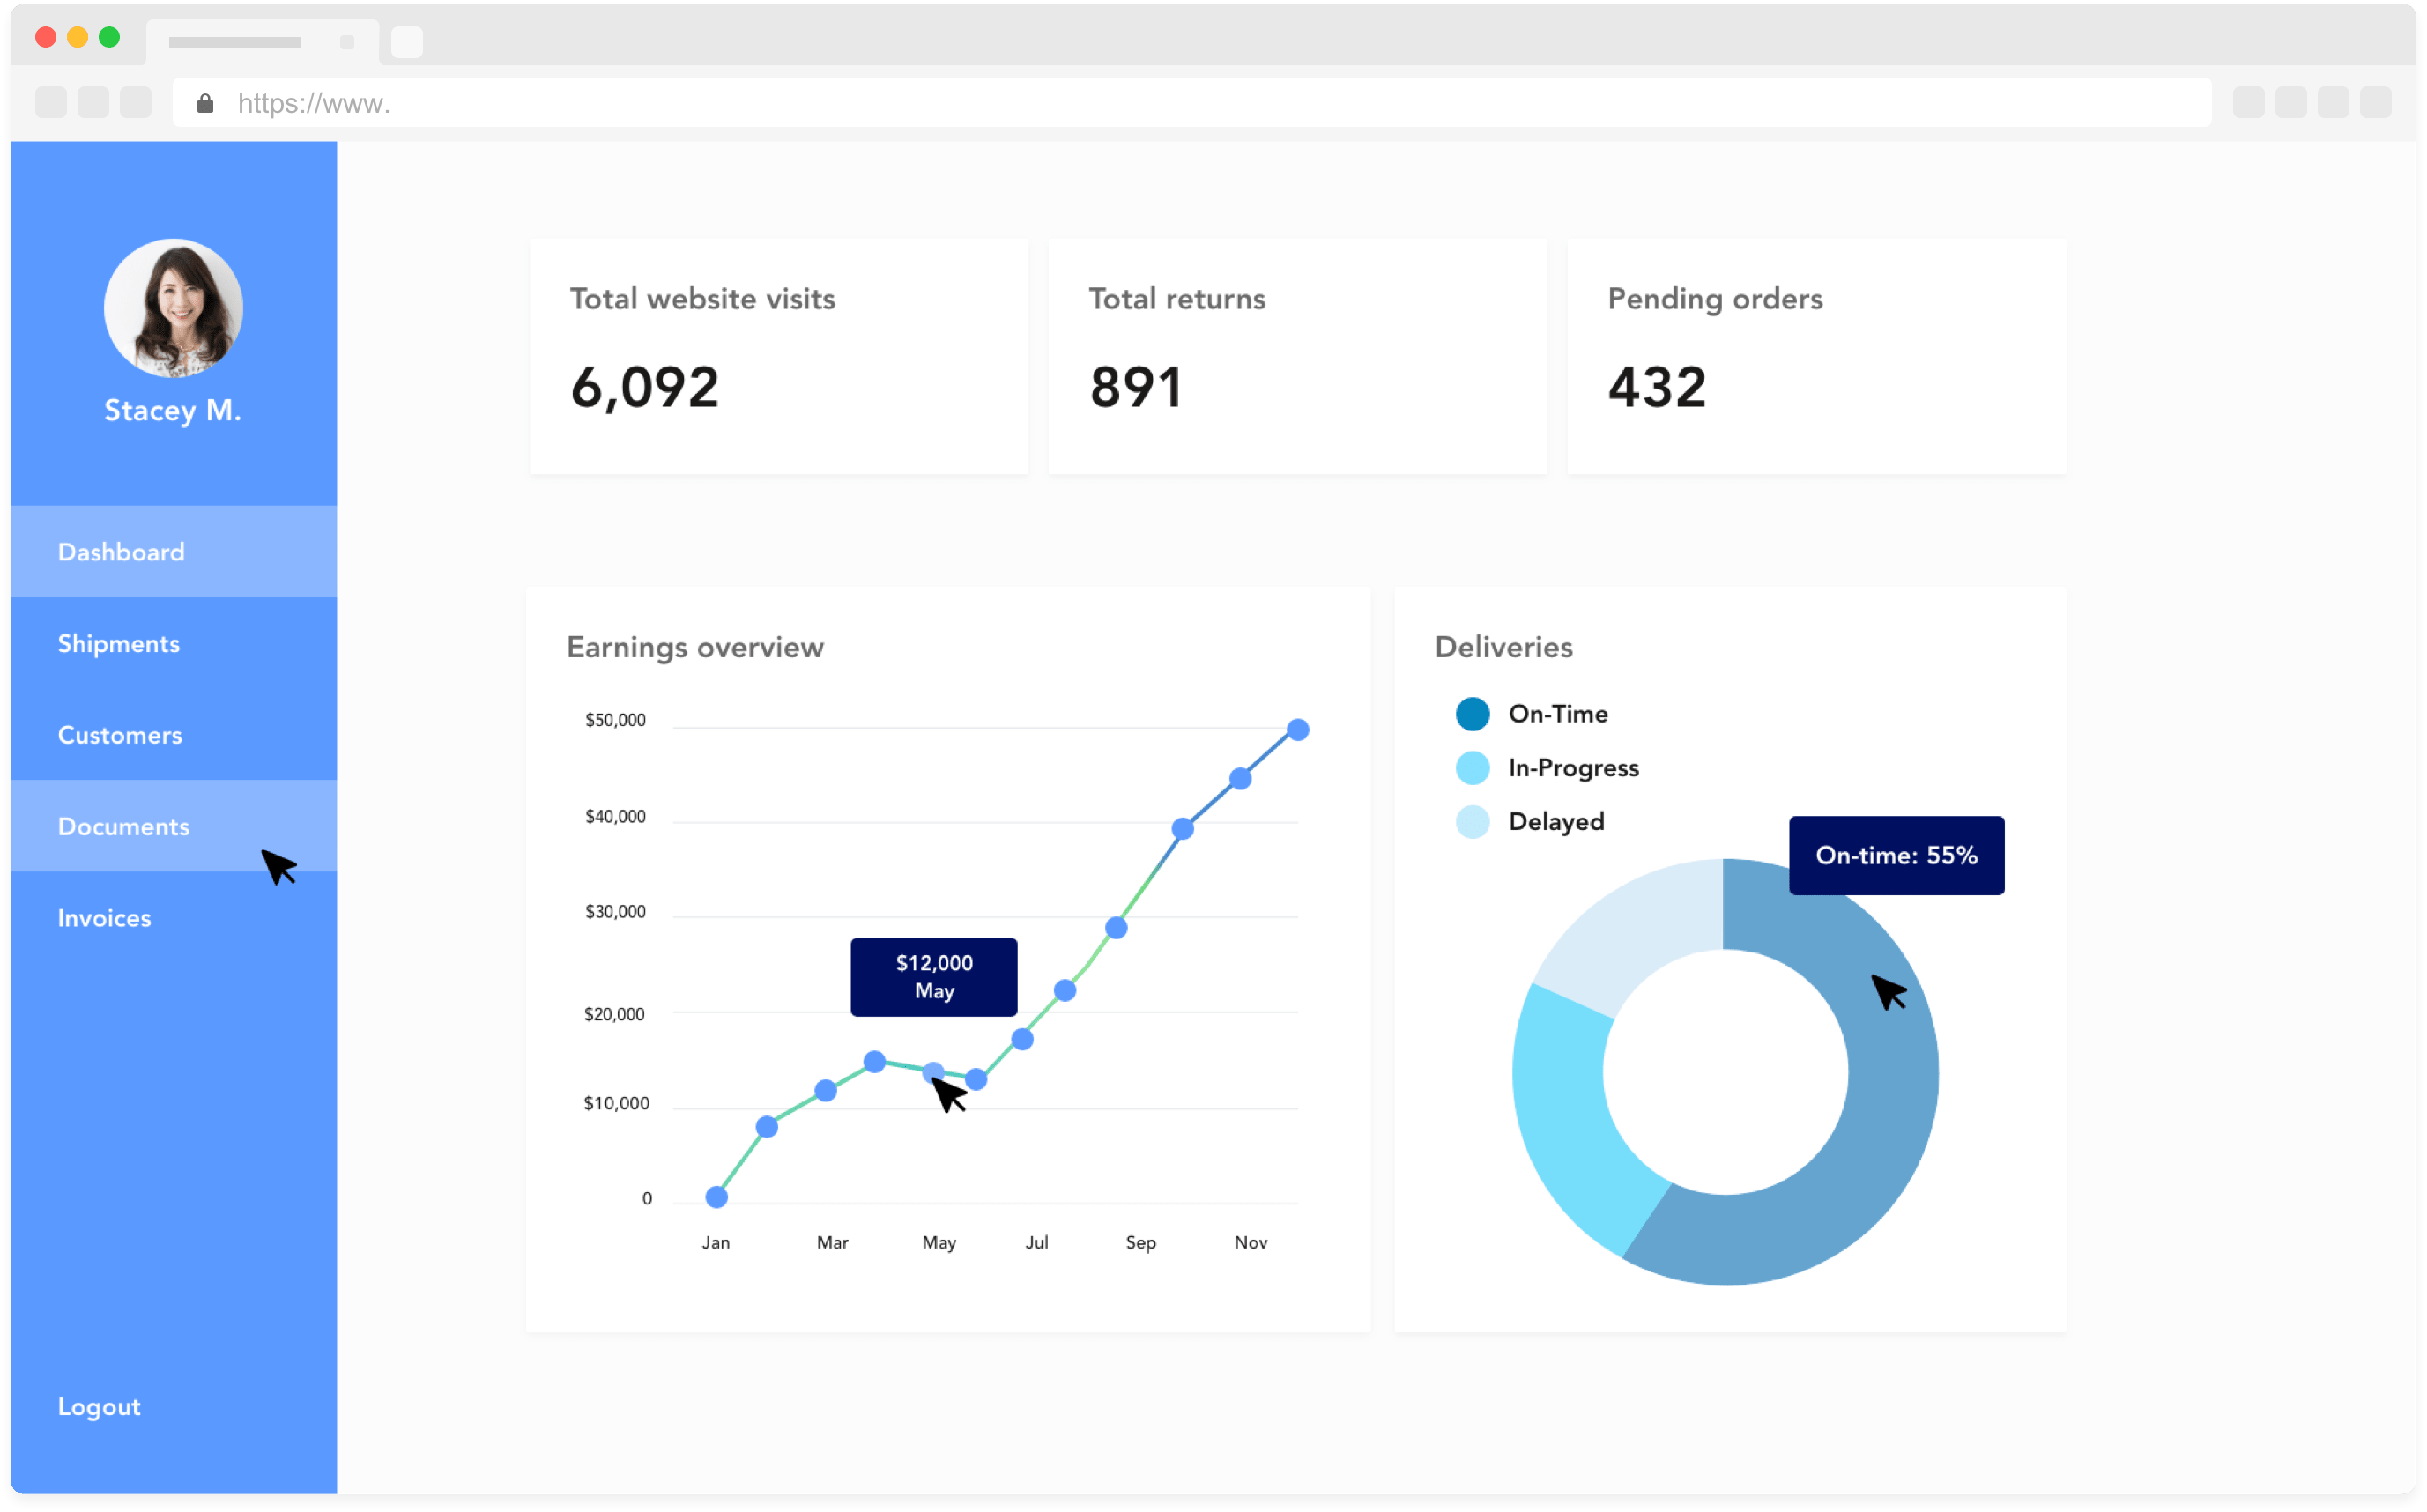
To try out the prototype, click here